After logging in to the back-office a central overview page will be displayed, containing an overview of the connected assets and their statistics.
Notifications & Alerts
In the top right corner, between the language settings and the logged-in username, two Notification & Alerts icons are displayed:
Messages
This section houses all customer tickets and messages. Keep in mind, you are not able to reply to them via EVC-net.
Alerts
Here, you can find the status of seven alerts in total, related to charge points or functionalities within the back-office itself. Action may be required based on the color indications.
- Accounts awaiting activation by the provider – Companies and customers awaiting account activation if automatic account activation is disabled.
- Charge card requested by customer – Customers who have requested a charge card to be sent to them.
- No customer attached to charge point – Charge points without an owner.
- No location attached to charge point – Charge points without a location attached.
- No subscription attached to charge point – Active charge points without a subscription (hosting product) attached.
- Wrong subscription (e.g. private instead of public) attached – Incorrect subscription attached to a charge point, such as a private charge point subscription assigned to a public charge point.
- Overview of customers who will receive a payment reminder – A list of customers who will receive payment reminders for unpaid invoices.
Dashboard
Map
Depending on your preferred settings, the map displays charge points that you own and/or roaming charge points, along with their statuses:
- Available – Charge point is online, available, but not currently in a charging session.
- Charging – Charge point is online, available, but not currently in a charging session.
- Faulty – Charge point is online but has a technical fault.
- Unknown – Charge point is offline.
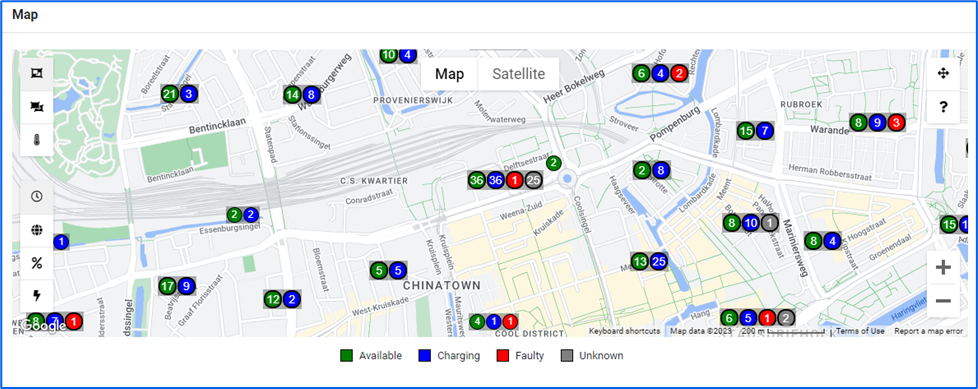
On the left side of the map, you will find several settings to adjust the map view:
Clicking on a charge point (or cluster) will reveal its details.
Occupancy
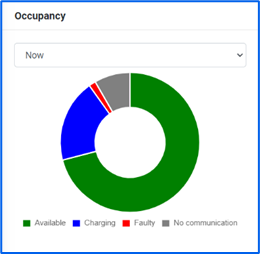
The graph displays the average occupancy of all charge stations in percentage, categorized by charge station status. You can choose the timeframe from the dropdown list.
Status:
- Available – charge point is online, but not in charging session.
- Charging – charge point is online and in charging session.
- Faulty – charge point is online, but faulty.
- Unknown – charge point is offline.
Current
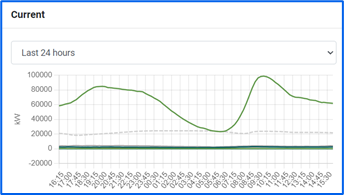
This graph illustrates the current usage of your charging stations.
- The green line represents the current power (in kW) on your network of charging stations. kW represents the total instantaneous power delivered by the charge points at the specified time.
- The grey line indicates the number of transactions.
Energy Usage
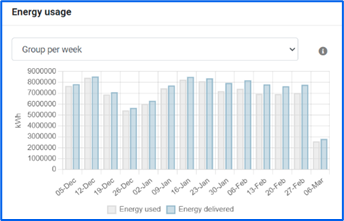
This graph is organized by day, week, month, or year and displays Energy Used and Energy Delivered in kWh.
- Energy used: TThe energy charged to customer charge cards (e-MSP) at customer charge stations and/or within the roaming network.*
- Energy delivered: The energy delivered by customer charge stations (CPO) to customer charge cards or third-party charge cards.*
*If a charge session applies to both options, it will be counted in both statistics, without exclusion.
Statistics
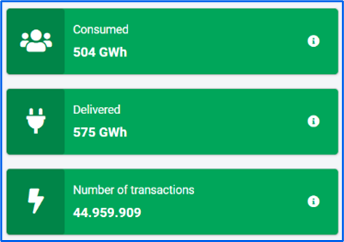
Consumed – The total energy consumed using your charge cards at your charge points and/or at third-party (roaming) charge points.*
Delivered – The total energy delivered by your charge points to your charge cards and/or third-party (roaming) charge cards.*
Number of transactions – The total number of transactions on your charging stations.
*If a charge session applies to both options, it will be counted in both statistics, without exclusion.
Energy with or without profit margin
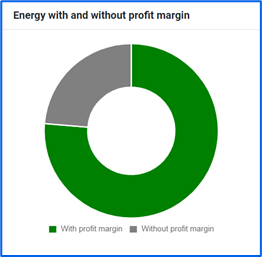
This graph shows the percentage ratio between energy with a profit margin and energy without a profit margin.
- The green line represents the percentage of energy with a profit margin, indicating the portion of energy delivered where you earn a profit based on the tariff used.
- The grey line represents the percentage of energy delivered with no profit margin, including scenarios like the A0 tariff or home charging tariffs with zero profit margin for you as the provider.
Costs and benefits
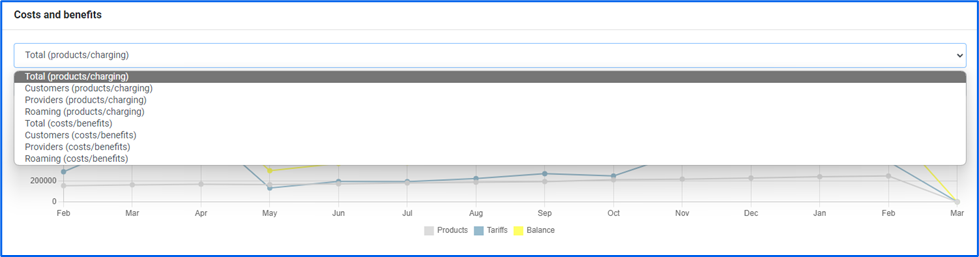
Total (products/charging)
This report displays the amount of profit you, as the provider, earn from products and tariffs. The balance is the sum of these:
Product – is a sum of hosting product profit and charge card subscription profit:
- hosting product on your charge stations that you are reselling to your customers (hence you have a profit margin, calculated as: total price paid by customer for charge station hosting product – hosting paid to LMS (based on your contract with LMS) = profit margin)
- charge card subscription – these are either one time or monthly subscriptions you may charge your customers for using charge cards.
Tariff – The profit from charge transactions (hence from the tariffs).
Balance – represents the sum of Products and Tariffs, giving the total profit amount.
Customers (products/charging)
This report illustrates the amount of profit you, as the provider, earn from products and tariffs provided to your customers. The balance is the sum of these.
Providers (products/charging)
This report shows the amount of profit you, as the provider, earn from products and tariffs as a provider. The balance is the sum of these.
Roaming (products/charging)
This report displays the amount of profit you, as the provider, earn from products and tariffs related to roaming transactions. Typically, Products amount to zero since no products are charged within the roaming network. The balance is the sum of these.
Total (costs/benefits)
This report showcases the difference between the benefits (the profit you earn) and the costs you incur.
- Profit – includes hosting product profits from your charge stations, charge card subscription earnings, and tariff margins.
- Costs – encompass hosting products you pay for charge stations and the transaction costs for your customers using roaming stations.